Stop Sending GeoJSON to LLMs: 6 Formats Tested for Spatial Reasoning
I wanted an AI agent to reason about map data — answer questions like “which building is closest to the road?” or “where should I build next?” The obvious approach is to send GeoJSON. But a single viewport at zoom 18 costs 39,000 tokens. That’s 20% of Claude’s context window for one small view.
So I went on a journey to find the most token-efficient format that an AI can actually reason about spatially. The answer surprised me.
Three Kinds of GIS Agent
Most AI-GIS work I’ve seen falls into a few buckets:
- Database agents — natural language to SQL/PostGIS. You ask “show me all buildings within 500m of a school” and the agent writes the query. This is the most common type; CARTO demoed one at a meetup last year.
- Layer configuration agents — like OpenGeoAI, where the AI helps you set up map styles, choose layers, and configure visualizations.
- AI-native GIS platforms — like Mundi.ai, an open-source web GIS where the LLM calls geoprocessing algorithms, edits symbology, and queries PostGIS databases. It combines database querying with layer management into a full spatial workbench.
These are all powerful, but they’re mostly read-and-configure oriented: the agent queries data or adjusts how it’s displayed, but doesn’t need to understand what’s spatially around a specific point.
There’s another kind — digitizing agents — where the AI needs to look at a map area and make spatial decisions: place a pin, trace a boundary, split a parcel. This is where token-efficient spatial formats matter most, because the agent is reasoning about geometry in a tight feedback loop.
The Setup
Two test areas:
- Rural DRC (eastern Congo) — 15 buildings, 1 dirt path, residential scrubland
- Urban Bangkok — 2 temples, 5 named roads, 1 canal
Data extracted from OpenStreetMap via the Overpass API, clipped to the map viewport.
Step 1: Raw GeoJSON Is Terrible
Starting point: query Overpass, convert to GeoJSON, measure tokens.
Raw Overpass JSON:  579 KB  ~148,000 tokens
Converted GeoJSON:  156 KB   ~39,000 tokens
Even after conversion, 39K tokens is absurd. And the AI would need to do coordinate math to answer “what’s north of what?” — it can’t just look at lat/lng numbers and know.
Step 2: Clip to Viewport (The Biggest Win)
The first optimization was embarrassingly simple: clip features to the bounding box.
Overpass returns any feature that touches the bbox. A huge residential polygon that barely intersects the viewport? You get all 200 of its coordinate pairs. Clipping to the bbox alone dropped the size from 156KB to 6.8KB — a 95.6% reduction.
| Optimization | Size | Tokens | vs Baseline |
|---|---|---|---|
| Baseline GeoJSON | 156 KB | 39,114 | 100% |
| Clip to bbox | 6.8 KB | 1,719 | 4.4% |
| + Strip source tags | 5.6 KB | 1,404 | 3.6% |
| + Round coords (5dp) | 6.3 KB | 1,578 | 4.0% |
| + Drop untagged | 4.9 KB | 1,232 | 3.2% |
| All combined | 5.0 KB | 1,263 | 3.2% |
Everything after clipping was marginal. Rounding coordinates to 5 decimal places (1m accuracy), stripping OSM metadata tags, removing untagged features — combined, they added only 1.5% more reduction on top of clipping.
Step 3: H3 Hexagonal Indexing
Instead of coordinates, what if we used H3 hexagonal grid cells? Each res-12 cell is ~10m across. We can:
- Find the common parent cell (res 8 covers the whole viewport)
- Represent each cell as a 4-digit child-index path
- List what’s inside each cell
{
  "root": "886ac3c15bfffff",
  "cells": {
    "3562": {"building": 4, "landuse=residential": 1},
    "3000": {"building": 3, "landuse=residential": 1},
    "3465": {"highway=path": 1}
  }
}
This is 3,500 chars (~880 tokens) — compact, but the AI can’t derive direction or distance from H3 child indices. The spatial relationships are implicit in the hex grid but opaque to a language model.
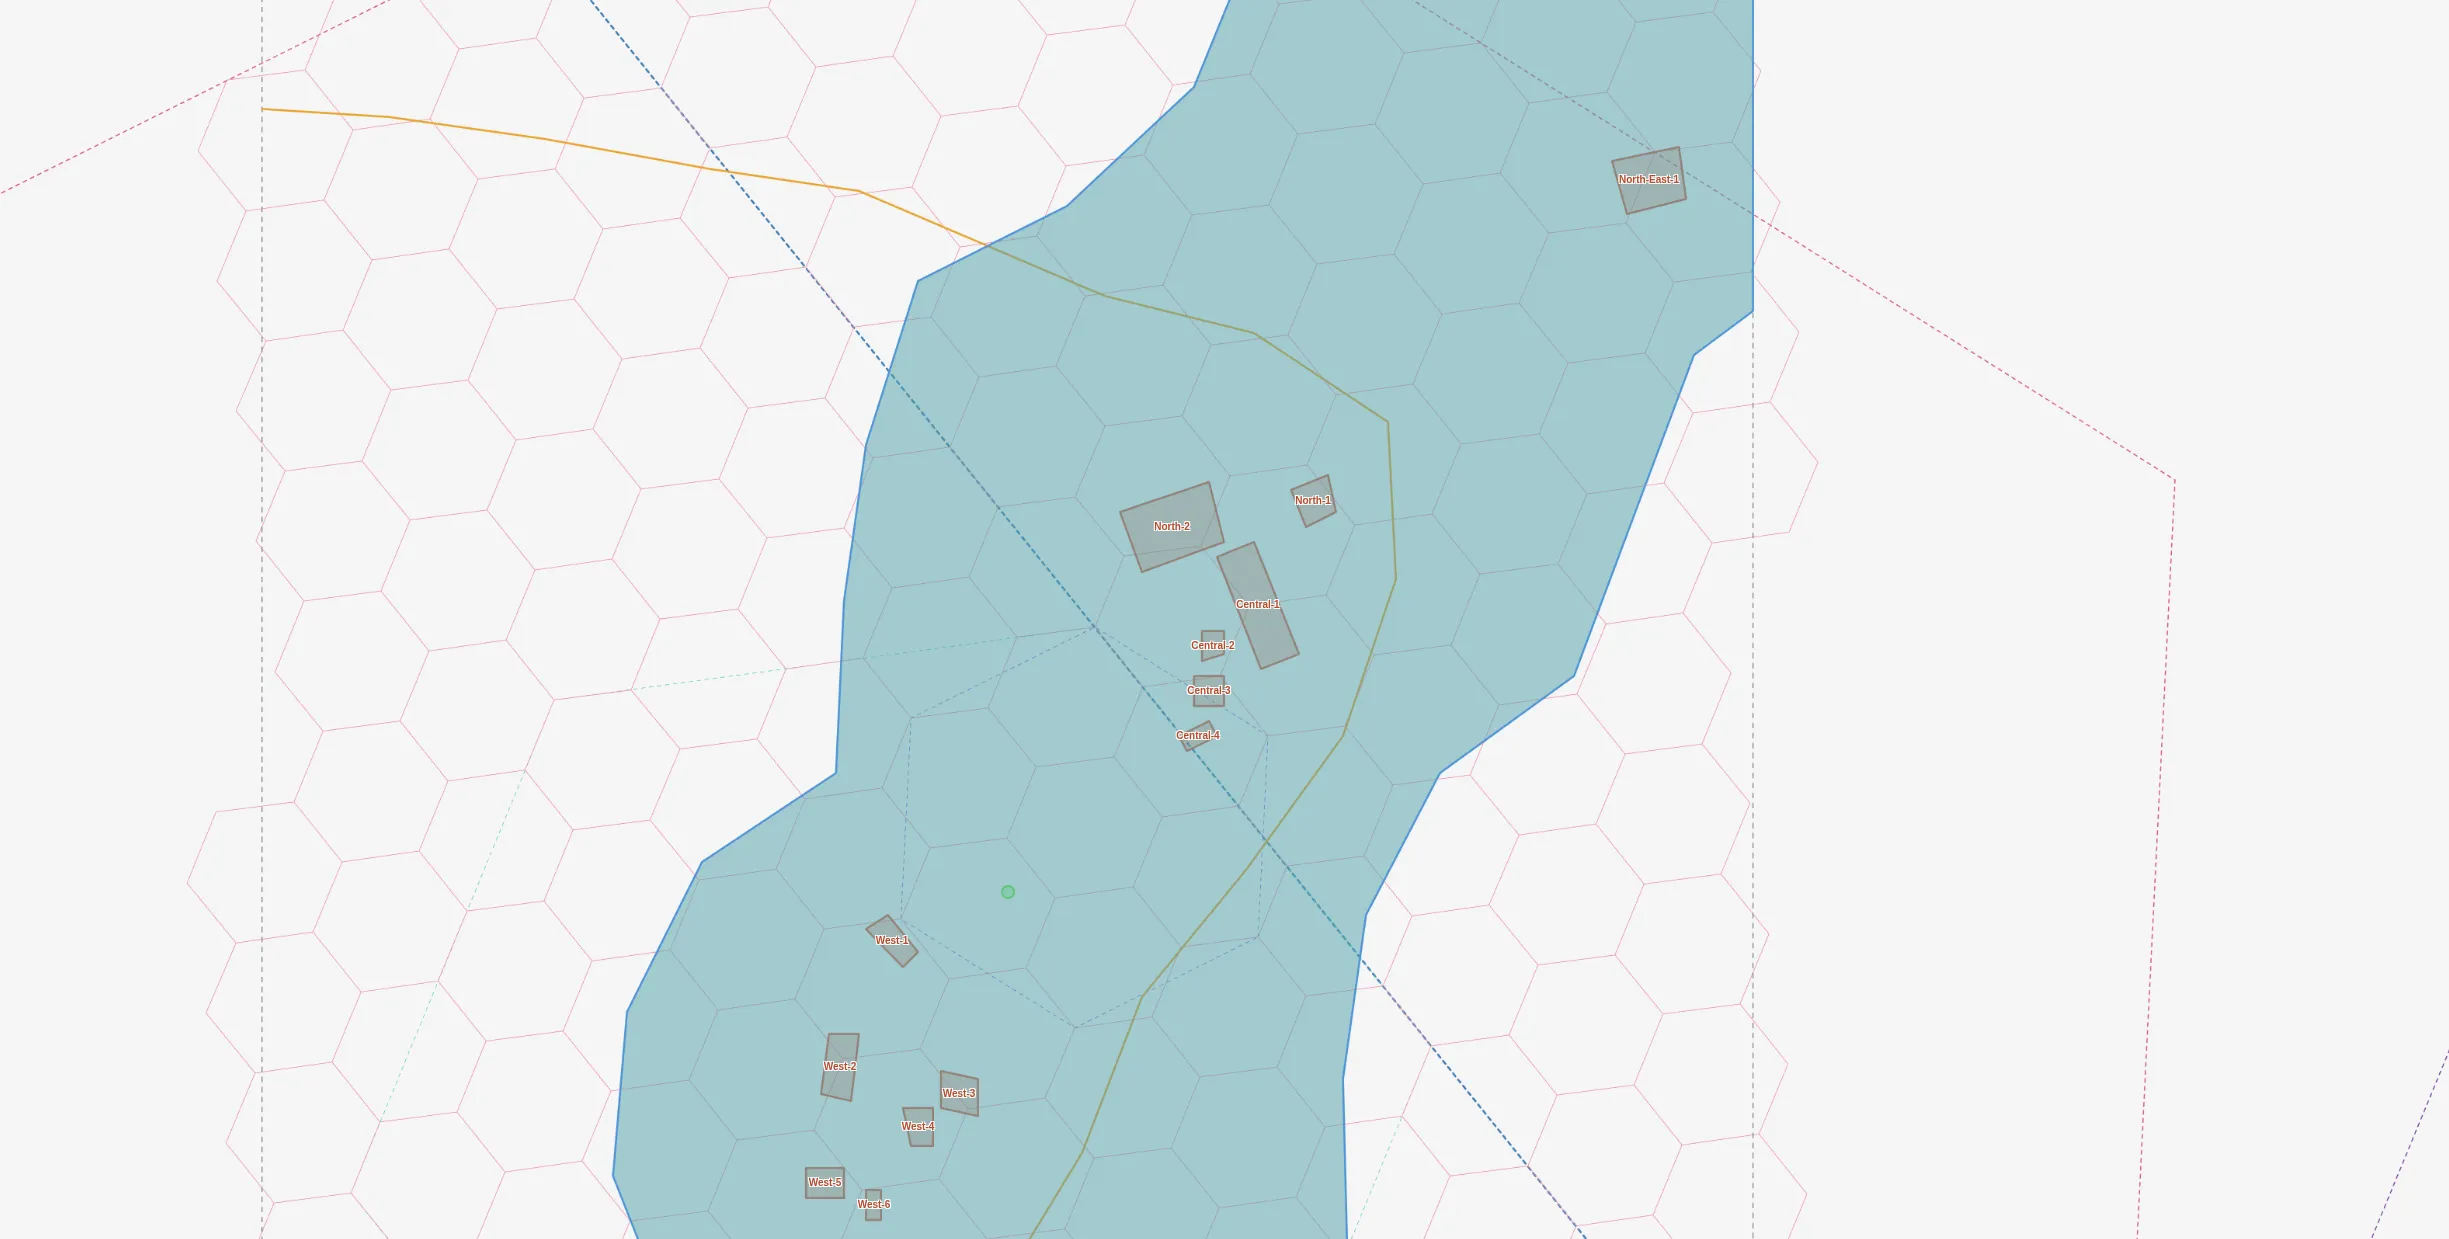
Step 4: Natural Language Description
What if we just describe the area in plain English?
Area: residential zone in eastern DRC.
A dirt path runs NE to SW through the area.

15 buildings in 5 clusters:
- North-East (1): 1 large building, 60m from path
- North (2): 1 medium + 1 compound (~126m2), near path
- Central (4): straddling the path (0-40m)
- West (6): dense cluster, 20-53m E of path
- South (2): 40-53m from path
~173 tokens. Clean, readable, and an AI can reason about it directly. But it’s wordy and can propagate errors — my description accidentally said “18 buildings” instead of 15, and the AI confidently repeated it.
Step 5: Compact Grid Notation
A machine-readable format: building count, grid position, road relationship.
# residential + scrub | path runs NE->SW
B3@4,9 road:20m-E
B1@4,11 road:0m-N
B4@12,13 road:20m-E
B1@20,21 road:60m-SW
~121 tokens. But in benchmarks, the AI misunderstood the format — it summed cell counts and got 29 buildings instead of 15, because the same building can intersect multiple grid cells. Format ambiguity kills accuracy.
Step 6: Raycast (The Winner)
The insight: cast 8 rays from a subject point and report what each ray hits first. Like standing somewhere and looking around.
@(-0.063,29.834)
inside: residential zone, scrub

 N: path@25m -> NE-1(bldg)@118m
NE: path@25m -> C-3(shed)@39m
 E: path@25m -> C-1(compound)@64m
SE: path@25m
 S: W-2(bldg)@31m
SW: W-5(bldg)@72m
 W: -
NW: -
~57 tokens. Add a context block with cluster totals (~80 tokens more) and the total is ~137 tokens.
Why this works:
- “inside” is the highest-value signal — tells context immediately
- First-hit-only mimics human perception — you don’t catalog everything, just what’s nearest
- Empty directions mean open space — also useful information
- Subject-centric — only describes what matters from this viewpoint
For Bangkok, the raycast immediately reveals the subject is inside a temple compound:
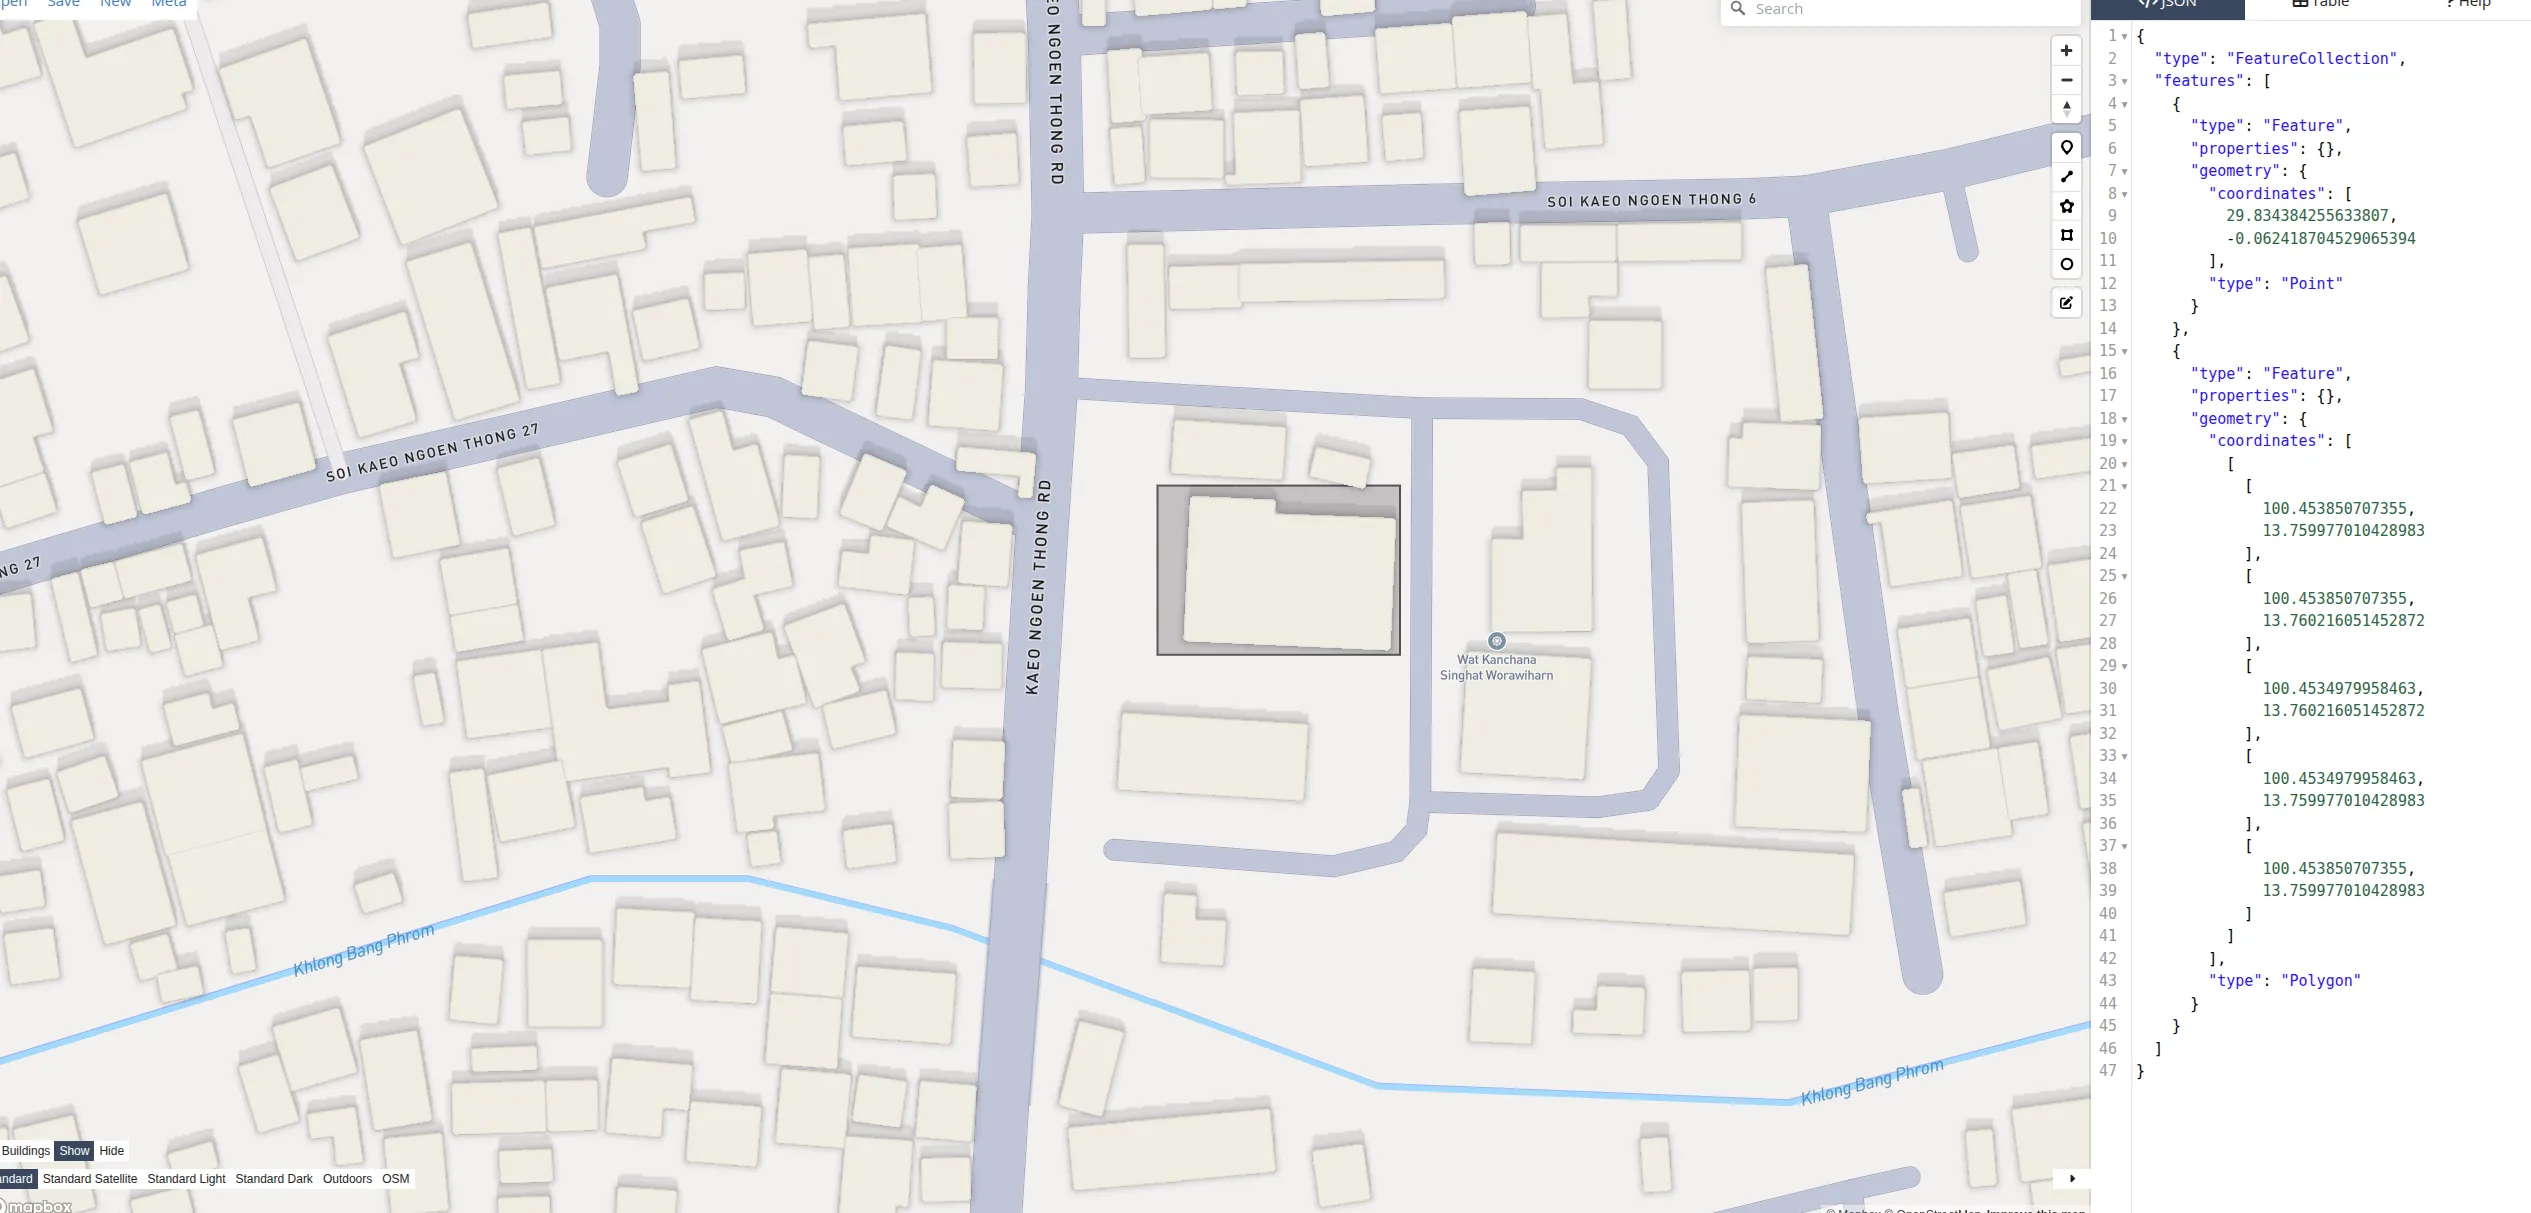
@(13.760,100.454)
inside: Wat Kanchana Singhat (temple)

SE: service_road@23m
SW: Kaeo Ngoen Thong Rd@37m
 W: Kaeo Ngoen Thong Rd@37m
~94 tokens for an urban viewport with named roads, temples, and a canal.
The Benchmark
I gave 3 AI agents the same 8 spatial reasoning questions, each with a different format:
| Format | Tokens | Score | Efficiency |
|---|---|---|---|
| Raycast + context | 137 | 8/8 | 58/1K tok |
| Natural language | 173 | 6.5/8 | 37/1K tok |
| Compact grid | 121 | 5/8 | 41/1K tok |
| Screenshot (est.) | ~3,200 | ~7/8 | ~2/1K tok |
Questions tested counting (“how many buildings?”), direction (“what’s south of center?”), distance (“is building X close to the road?”), and reasoning (“where should a new building go?”).
The raycast agent got every question right. The natural language agent was close but repeated a data error. The compact grid agent misinterpreted the format and double-counted buildings.
What I Learned
1. Format matters more than data volume. The 57-token raycast outperformed 39,114 tokens of raw GeoJSON. More data doesn’t mean better reasoning.
2. Clipping is the single biggest win. 95% of GeoJSON tokens were features outside the viewport. Always clip first.
3. AI can’t do coordinate math. Don’t send lat/lng pairs and expect spatial reasoning. Convert coordinates to human-readable relationships: directions, distances, names.
4. Compact formats can backfire. The grid notation was the second-smallest format but scored worst because its encoding was ambiguous to the AI.
5. Screenshots are expensive and low-value for AI. ~3,200 tokens for a map image that an AI can’t precisely read distances from. Reserve screenshots for human viewing.
6. Subject-centric beats area-centric. Raycast describes only what’s relevant from a specific viewpoint. This mirrors how humans think about space — not “list everything in the area” but “what’s around me?”
The Recommended Stack
| Need | Format | Cost |
|---|---|---|
| “What’s at this spot?” | Raycast + context | ~100-150 tokens |
| “Describe this whole area” | Natural language | ~170-360 tokens |
| Human visualization | Styled map screenshot | ~3,200 tokens |
| Code/GIS processing | Clipped GeoJSON | ~1,200 tokens |
"What's at this spot?" — subject-centric, 8/8 accuracy
"Describe this whole area" — readable but verbose
Human visualization — expensive for AI
Code/GIS processing — machine-readable
For an AI map agent, the pipeline is:
- Overpass API to extract OSM data for a viewport
- Shapely clip to the bounding box (95% token reduction)
- Raycast from the point of interest (another 95% reduction)
- Context block with area summary (cluster names, counts, land use)
Total: ~137 tokens to describe a map viewport that would otherwise cost 39,000. A 700x compression with perfect spatial reasoning accuracy.
Real-World Use Cases
This isn’t theoretical. I’ve been building toward digitizing agents in two projects:
Ballot Station Placement
For Thailand’s election geocoding project, I built an interactive map tool that an AI agent controls via the Anthropic Agent SDK. The agent has tools like map.add_layer(), map.describe(), map.screenshot(), and map.measure() — it places candidate pins, checks containment in administrative boundaries, and iterates.
The key design: describe() is the cheap text feedback loop (~100 tokens per call), and screenshot() is the expensive visual fallback (~3,200 tokens). The agent calls describe() 10-15 times per task but screenshot() only 1-2 times — when it needs to visually confirm road layout or building footprints. This two-tier approach directly uses the format hierarchy from this article: raycast-style text descriptions for fast iteration, screenshots only for geometry that text can’t capture.
Land Parcel Subdivision
I also built a web tool for splitting land parcels — place reference points, draw split lines (perpendicular, parallel), select grid cells, and assign them to parts, with area calculations in Thai rai-ngan-wah units and GeoJSON export.
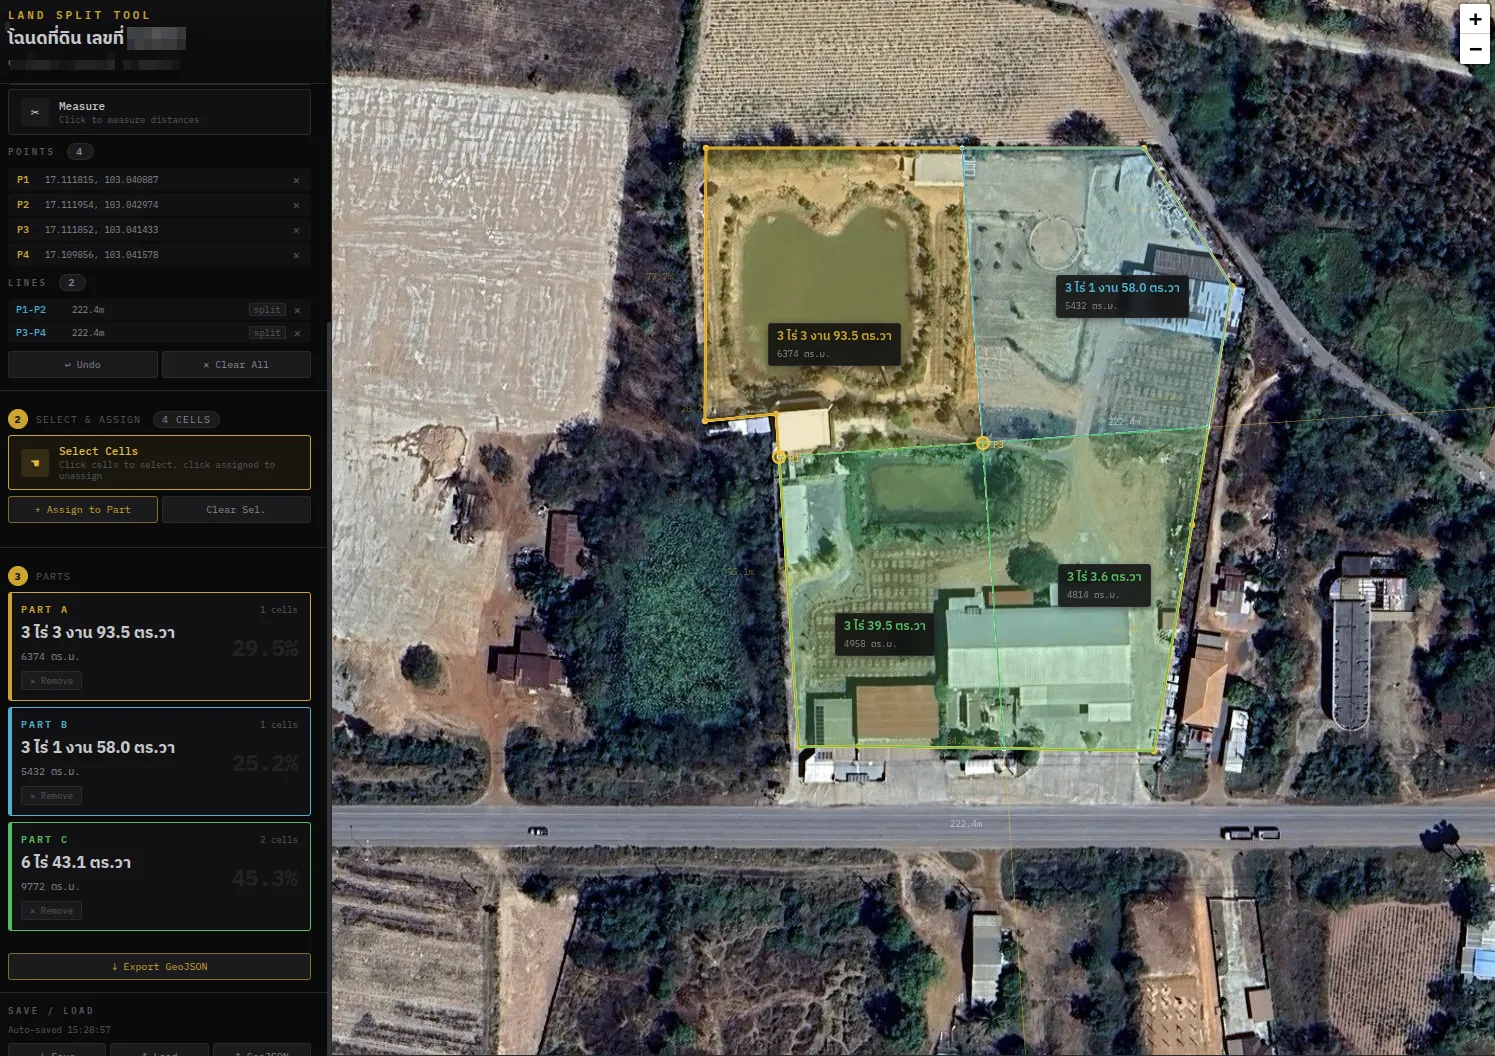
This is exactly the kind of task a digitizing agent could help with: “split this parcel into 3 equal parts, with each part having road frontage.” The agent would need to understand the parcel shape, the road direction, calculate areas, and propose split lines — all requiring tight spatial reasoning at ~9m resolution.
Both projects convinced me that the bottleneck for GIS agents isn’t capability — it’s spatial representation. An agent that can reason about “what’s north of me, 25 meters away” in 57 tokens will always outperform one parsing 39K tokens of coordinate arrays.
The code for all of this — the extraction pipeline, format converters, benchmark harness, and the styled screenshot map — is in the nami repository.